ACTIVE Net® Insights
Business Intelligence & Reporting Software

ACTIVE Net Insights is our business intelligence portal for operational reporting. Whether it’s reporting for your non-profit, community or recreation organization, we turn the collection of numbers and names that make up your data into valuable information that helps you create an engaged, active community, understand customer trends, and make better business decisions.
Intuitive Interface and Collaboration
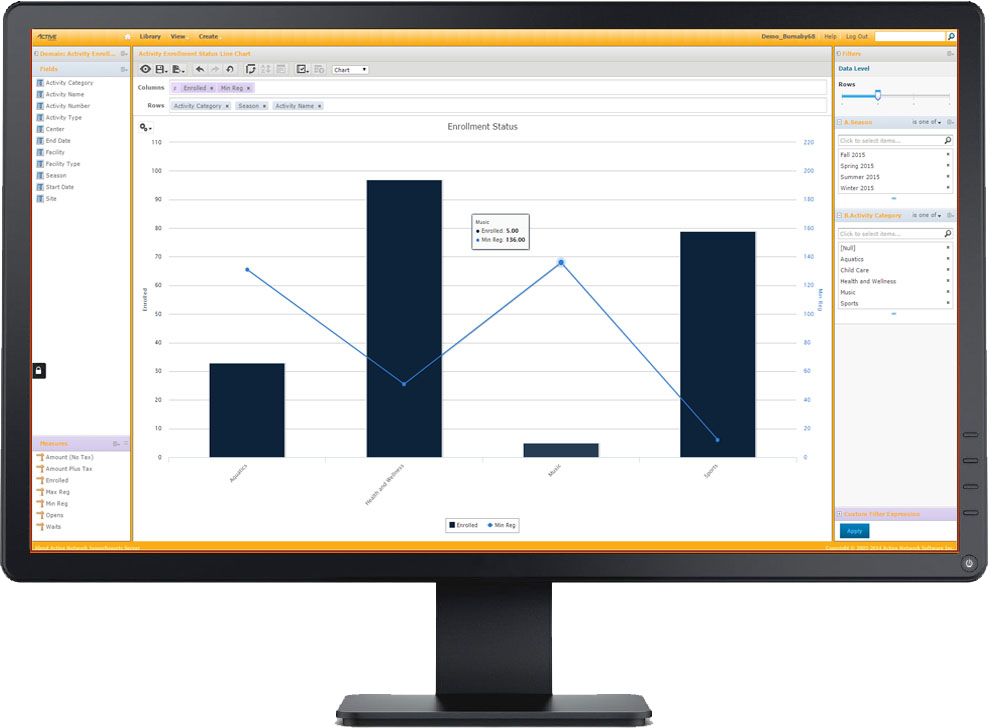
Our reporting software offers a convenient drag and drop report interface so non-technical users can easily analyze data and create interactive reports. View your reports with stunning visualizations and animations in multiple formats. Plus, share with colleagues with just a few clicks.

Standard Reports
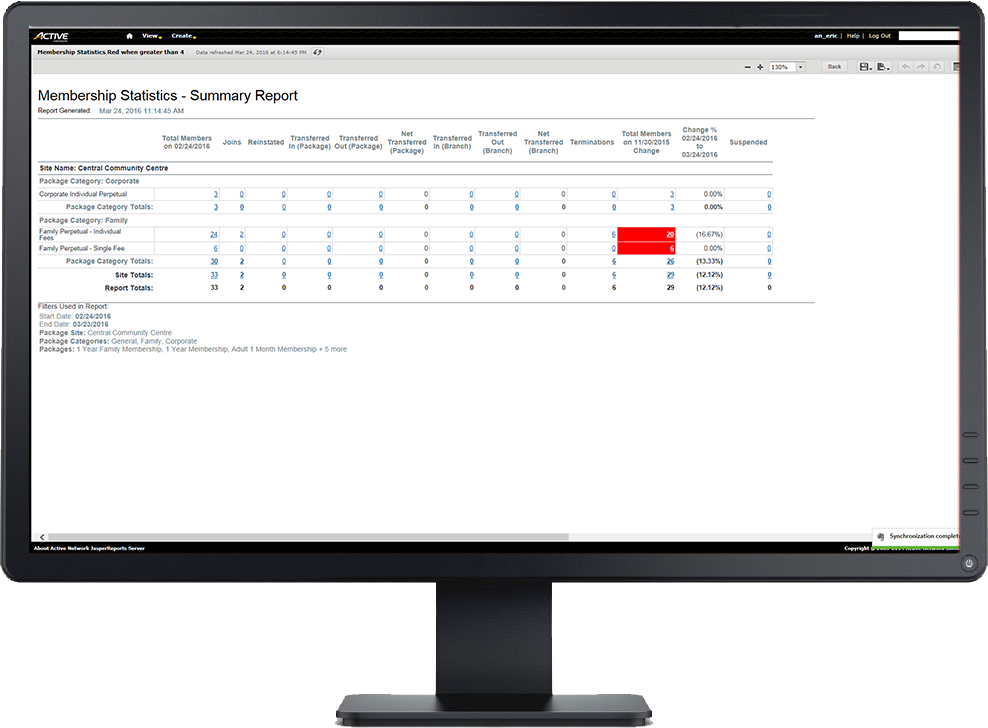
For your daily operations, why reinvent the wheel? You’ll find a collection of the standard reports you need, built right into the system. You can quickly view or print out rosters and participants lists, report on attendance, or dig into your financials just by setting a few filters.

Interactive Reports
Drill down into the data that matters to you. You don’t always get the detail you need from static reports. Reports from ACTIVE Net Insights allow you to filter, sort, and even hide columns. Since it’s all done in your browser, you can easily click through to the granular details you care about.
Custom Ad Hoc Editor
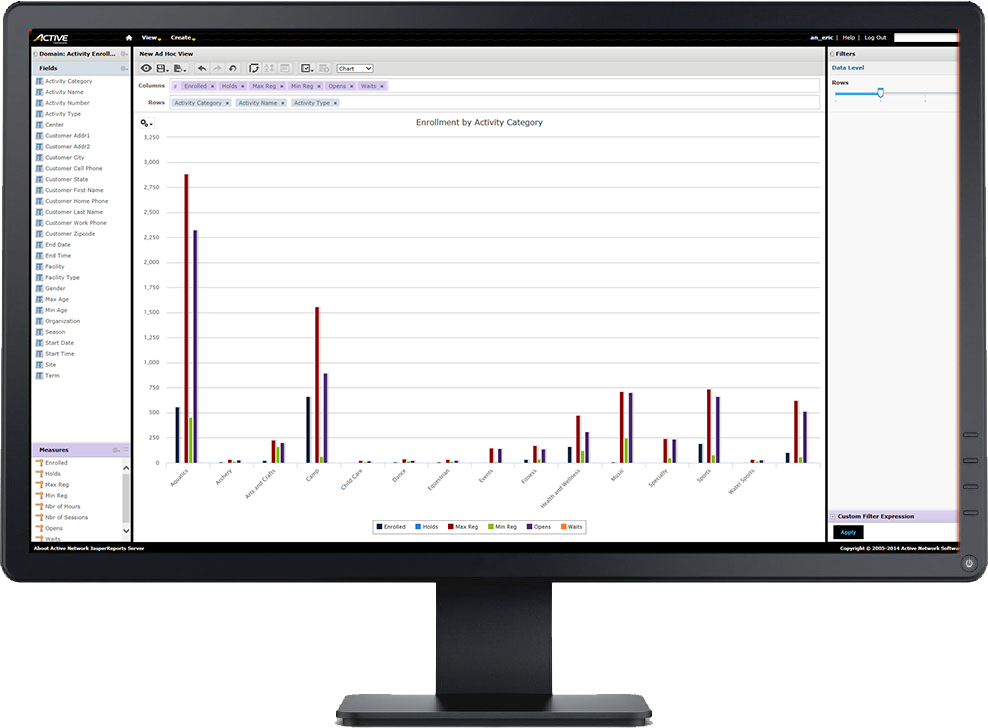
Sometimes you need a more customized report for a specific business process or event. In that case, head over to the ad hoc domains to create a report with the measurements and filters you require. Once you’ve created your reporting masterpiece, save it to your library or save yourself time with custom report scheduling.

Business Information at a Glance
We know the feeling—you need that important piece of information right now! Coming this year, the dashboard in ACTIVE Net Insights will combine data and graphical indicators to deliver at-a-glance summaries of information for users to quickly take action. No need to search through reports for that information needle in the database haystack.
Ready to see more?
Get started with ACTIVE Net®.